List of Canadian provinces and territories by life expectancy
This is a list of Canadian provinces and territories by life expectancy. Life expectancy is the average number of years of age that a group of infants born in the same year can expect to live, if maintained, from birth. The source is from the Canadian Vital Statistics Death Database.[1]
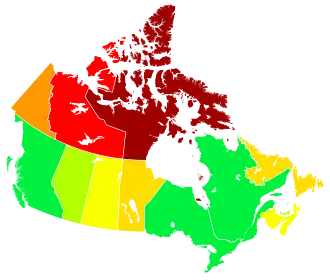
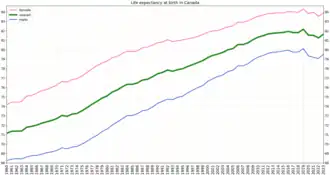
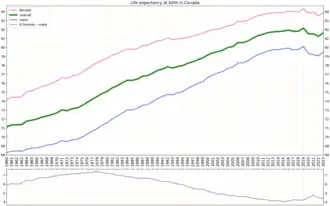
Life expectancy has increased in most Canadian provinces and territories due to medical advances in treating diseases such as heart disease and cancer - leading causes of death elsewhere worldwide. There were high gains in life expectancy in Nunavut due to improved rural health care; however, there were notable decreases in life expectancy in Newfoundland and Labrador.
Life expectancy in 2023 at birth
| province | 2019 | 2019 →2022 |
2022 | 2021 →2023 |
2023 | 2019 →2023 | |||||||||
|---|---|---|---|---|---|---|---|---|---|---|---|---|---|---|---|
| overall | male | female | F Δ M | overall | male | female | F Δ M | overall | male | female | F Δ M | ||||
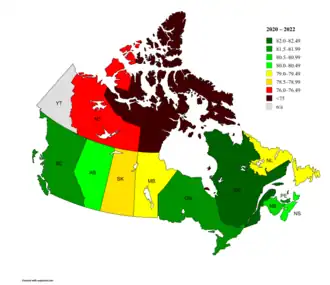
| Canada on average | 82.23 | 80.11 | 84.32 | 4.21 | −0.94 | 81.29 | 79.06 | 83.54 | 4.48 | 0.41 | 81.70 | 79.51 | 83.89 | 4.38 | −0.53 |
| Quebec | 82.84 | 80.92 | 84.70 | 3.78 | −0.52 | 82.32 | 80.54 | 84.06 | 3.52 | 0.23 | 82.55 | 80.77 | 84.30 | 3.53 | −0.29 |
| British Columbia | 82.74 | 80.56 | 84.96 | 4.40 | −1.30 | 81.44 | 78.75 | 84.25 | 5.50 | 0.51 | 81.95 | 79.31 | 84.71 | 5.40 | −0.79 |
| Ontario | 82.55 | 80.39 | 84.67 | 4.28 | −0.75 | 81.80 | 79.55 | 84.05 | 4.50 | 0.53 | 82.33 | 80.13 | 84.52 | 4.39 | −0.22 |
| Alberta | 81.96 | 79.86 | 84.11 | 4.25 | −1.77 | 80.19 | 77.91 | 82.59 | 4.68 | 0.47 | 80.66 | 78.34 | 83.10 | 4.76 | −1.30 |
| New Brunswick | 80.74 | 78.47 | 83.03 | 4.56 | −1.01 | 79.73 | 77.73 | 81.77 | 4.04 | 0.71 | 80.44 | 78.42 | 82.50 | 4.08 | −0.30 |
| Saskatchewan | 80.50 | 78.23 | 82.95 | 4.72 | −1.90 | 78.60 | 76.23 | 81.16 | 4.93 | 0.39 | 78.99 | 76.70 | 81.40 | 4.70 | −1.51 |
| Nova Scotia | 80.45 | 78.52 | 82.29 | 3.77 | −0.63 | 79.82 | 77.62 | 82.03 | 4.41 | 0.66 | 80.48 | 78.33 | 82.67 | 4.34 | 0.03 |
| Manitoba | 80.19 | 78.03 | 82.54 | 4.51 | −0.95 | 79.24 | 76.74 | 81.92 | 5.18 | −0.14 | 79.10 | 76.90 | 81.46 | 4.56 | −1.09 |
| Newfoundland and Labrador | 80.07 | 78.06 | 82.14 | 4.08 | −1.16 | 78.91 | 76.98 | 80.80 | 3.82 | 0.20 | 79.11 | 77.08 | 81.13 | 4.05 | −0.96 |
Data source: Statistics Canada.[2]
3-year average:
.png)
| province or territory |
2017-2019 | change | 2021-2023 | ||||||
|---|---|---|---|---|---|---|---|---|---|
| overall | male | female | F Δ M | overall | male | female | F Δ M | ||
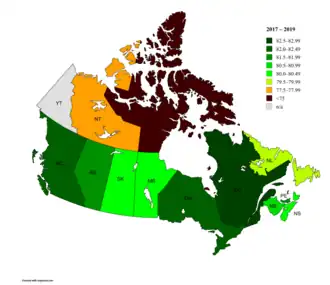
| Canada on average | 82.00 | 79.86 | 84.09 | 4.23 | −0.49 | 81.51 | 79.25 | 83.79 | 4.54 |
| Quebec | 82.56 | 80.68 | 84.34 | 3.66 | 0.04 | 82.60 | 80.75 | 84.38 | 3.63 |
| Ontario | 82.38 | 80.25 | 84.45 | 4.20 | −0.36 | 82.02 | 79.74 | 84.28 | 4.54 |
| British Columbia | 82.32 | 79.96 | 84.75 | 4.79 | −0.76 | 81.56 | 78.88 | 84.37 | 5.49 |
| Alberta | 81.59 | 79.34 | 83.91 | 4.57 | −1.25 | 80.34 | 77.92 | 82.91 | 4.99 |
| Prince Edward Island | 81.57 | 79.43 | 83.65 | 4.22 | −0.19 | 81.38 | 79.12 | 83.54 | 4.42 |
| New Brunswick | 80.70 | 78.54 | 82.81 | 4.27 | −0.38 | 80.32 | 78.26 | 82.43 | 4.17 |
| Nova Scotia | 80.41 | 78.36 | 82.43 | 4.07 | −0.16 | 80.25 | 78.04 | 82.53 | 4.49 |
| Saskatchewan | 80.29 | 77.99 | 82.71 | 4.72 | −1.62 | 78.67 | 76.31 | 81.18 | 4.87 |
| Manitoba | 80.03 | 77.87 | 82.23 | 4.36 | −0.69 | 79.34 | 76.94 | 81.88 | 4.94 |
| Newfoundland and Labrador | 79.97 | 77.97 | 81.98 | 4.01 | −0.79 | 79.18 | 77.11 | 81.24 | 4.13 |
| Northwest Territories | 77.68 | 75.72 | 79.70 | 3.98 | −0.93 | 76.75 | 73.83 | 79.84 | 6.01 |
| Nunavut | 70.64 | 68.65 | 72.71 | 4.06 | 0.14 | 70.78 | 68.49 | 73.37 | 4.88 |
Data source: Statistics Canada.[1][3] There are no data for Yukon for given periods. In 2014-2016 overall life expectancy in this territory was 78.67 years (75.90 for male and 81.47 for female).
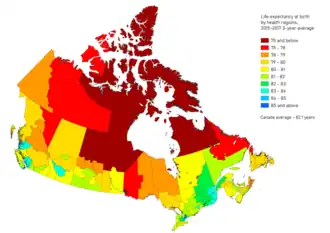
Life expectancy by health region, 2015-2017 3-year averages
| Health Region | Province | Life Expectancy[4] | Male[4] | Female[4] |
|---|---|---|---|---|
| Eastern | 79.7 | 77.6 | 81.8 | |
| Central | 79.5 | 77.7 | 81.3 | |
| Western | 79.5 | 78 | 80.8 | |
| Labrador-Grenfell | 77.9 | 75.7 | 80.3 | |
| Prince Edward Island | 82.0 | 79.9 | 83.8 | |
| Western | 80.9 | 78.6 | 83.1 | |
| Northern | 79.5 | 77.6 | 81.5 | |
| Eastern | 78.5 | 75.6 | 81.4 | |
| Central | 81.2 | 79.2 | 83.1 | |
| Moncton | 81.7 | 79.4 | 84 | |
| Saint John | 80.1 | 78 | 82.1 | |
| Fredericton | 80.9 | 79.1 | 82.6 | |
| Edmundston | 79.8 | 77.5 | 81.8 | |
| Campbellton | 79.4 | 76.5 | 82 | |
| Bathurst | 81.4 | 79.2 | 83.6 | |
| Miramichi | 79.5 | 76.2 | 82.6 | |
| Bas-Saint-Laurent | 82.2 | 80.1 | 84 | |
| Saguenay - Lac-Saint-Jean | 82.5 | 80.9 | 84 | |
| Capitale-Nationale | 83.3 | 81.4 | 84.9 | |
| Mauricie et du Centre-du-Québec | 82.3 | 80.1 | 84.3 | |
| Estrie | 83.1 | 81.1 | 84.9 | |
| Montréal | 83.1 | 81 | 85.1 | |
| Outaouais | 81.5 | 79.7 | 83.2 | |
| Abitibi-Témiscamingue | 80.4 | 78.5 | 82.3 | |
| Côte-Nord | 81.1 | 79.8 | 82.4 | |
| Nord-du-Québec | 80.6 | 79.3 | 81.4 | |
| Gaspésie - Îles-de-la-Madeleine | 80.8 | 78.7 | 82.8 | |
| Chaudière-Appalaches | 83.3 | 81.4 | 85.1 | |
| Laval | 83.9 | 81.9 | 85.6 | |
| Lanaudière | 82.1 | 80.6 | 83.6 | |
| Laurentides | 82.1 | 80.5 | 83.7 | |
| Montérégie | 82.8 | 81 | 84.4 | |
| Nunavik | 68.7 | 65.6 | 73 | |
| Terres-Cries-de-la-Baie-James | 77.2 | 75.4 | 78.7 | |
| Algoma | 79.4 | 77.2 | 81.6 | |
| Brant | 80.2 | 78.1 | 82.2 | |
| Durham | 82.5 | 80.6 | 84.4 | |
| Grey Bruce | 81.6 | 79.5 | 83.8 | |
| Haldimand-Norfolk | 80.2 | 78.3 | 82.1 | |
| Haliburton, Kawartha, Pine Ridge | 81.2 | 79.3 | 83.2 | |
| Halton | 84.5 | 82.6 | 86.2 | |
| Hamilton | 81.3 | 78.8 | 83.6 | |
| Hastings and Prince Edward | 80.1 | 77.8 | 82.4 | |
| Huron | 80.7 | 78.5 | 82.7 | |
| Chatham-Kent | 80.4 | 78.1 | 82.4 | |
| Kingston, Frontenac and Lennox and Addington | 81.5 | 79.1 | 83.8 | |
| Lambton | 80.5 | 78.3 | 82.7 | |
| Leeds, Grenville and Lanark | 81.3 | 79.4 | 83 | |
| Middlesex-London | 82.0 | 79.9 | 84 | |
| Niagara | 81.4 | 79.2 | 83.5 | |
| North Bay Parry Sound | 80.3 | 78.2 | 82.4 | |
| Northwestern | 76.6 | 74.7 | 78.6 | |
| Ottawa | 83.7 | 81.9 | 85.3 | |
| Oxford Elgin St. Thomas | 80.8 | 78.9 | 82.6 | |
| Peel | 84.8 | 83 | 86.4 | |
| Perth | 81.7 | 79.7 | 83.5 | |
| Peterborough | 81.5 | 79.3 | 83.5 | |
| Porcupine | 78.3 | 76.1 | 80.5 | |
| Renfrew | 81.1 | 79.2 | 83 | |
| Eastern | 81.2 | 79.1 | 83.2 | |
| Simcoe Muskoka | 81.6 | 79.7 | 83.4 | |
| Sudbury | 79.8 | 76.9 | 82.7 | |
| Thunder Bay | 78.9 | 76.8 | 81.1 | |
| Timiskaming | 79.3 | 76.9 | 81.7 | |
| Waterloo | 82.1 | 80.2 | 83.9 | |
| Wellington-Dufferin-Guelph | 82.3 | 80.5 | 83.9 | |
| Windsor-Essex | 81.7 | 79.7 | 83.7 | |
| York | 85.7 | 84 | 87.1 | |
| Toronto | 84.3 | 81.7 | 86.7 | |
| Winnipeg | 80.8 | 78.6 | 82.8 | |
| Prairie Mountain | 80.0 | 78 | 82.1 | |
| Interlake-Eastern | 80.3 | 78.6 | 82.2 | |
| Northern | 72.7 | 70.3 | 75.2 | |
| Southern | 81.0 | 79.1 | 83.1 | |
| Sun Country | 81.5 | 79.7 | 83.2 | |
| Five Hills | 81.3 | 78.4 | 84 | |
| Cypress | 81.4 | 79.3 | 83.5 | |
| Regina Qu'Appelle | 80.5 | 78.2 | 82.8 | |
| Sunrise | 79.5 | 76.7 | 82.4 | |
| Saskatoon | 81.3 | 79.1 | 83.4 | |
| Heartland | 80.9 | 78.2 | 83.7 | |
| Kelsey Trail | 78.8 | 76.4 | 81.4 | |
| Prince Albert Parkland | 78.3 | 75.4 | 81.6 | |
| Prairie North | 78.8 | 76.1 | 81.7 | |
| Mamawetan/Keewatin/Athabasca | 73.3 | 71 | 75.8 | |
| South | 80.3 | 78.1 | 82.4 | |
| Calgary | 83.1 | 81.2 | 85 | |
| Central | 79.9 | 77.4 | 82.6 | |
| Edmonton | 82 | 79.5 | 84.5 | |
| North | 79.2 | 77.1 | 81.7 | |
| East Kootenay | 80.5 | 78.5 | 82.7 | |
| Kootenay-Boundary | 80.4 | 77.9 | 82.8 | |
| Okanagan | 81.2 | 78.7 | 83.8 | |
| Thompson/Cariboo | 79.9 | 77.8 | 82.3 | |
| Fraser East | 81.2 | 78.7 | 83.7 | |
| Fraser North | 83.6 | 81.6 | 85.6 | |
| Fraser South | 82.8 | 80.6 | 85 | |
| Richmond | 86.8 | 85.2 | 88.2 | |
| Vancouver | 84.1 | 81.6 | 86.6 | |
| North Shore/Coast Garibaldi | 83.9 | 81.6 | 86.2 | |
| South Vancouver Island | 83.3 | 81.1 | 85.3 | |
| Central Vancouver Island | 81.3 | 79.2 | 83.3 | |
| North Vancouver Island | 81 | 78.6 | 83.5 | |
| Northwest | 79.1 | 76.9 | 81.7 | |
| Northern Interior | 78.8 | 76.9 | 81 | |
| Northeast | 78 | 76.4 | 79.6 | |
| Yukon[a] | 78.7 | 75.9 | 81.5 | |
| Northwest Territories | 77.1 | 75.2 | 79.3 | |
| Nunavut | 72.1 | 70.8 | 73.4 |
Life expectancy in 2020 at birth
| Rank | Province/Territory | Life expectancy
(2020)[2] |
3-year average (2018-2020)[1][3][a] | 3-year average (2008-2010)[1][3] | Change | ||
|---|---|---|---|---|---|---|---|
| All | Male | Female | |||||
| 1. | 82.34 | 82.57 | 80.77 | 84.31 | 81.24 | ||
| 2. | 82.19 | 82.39 | 79.93 | 84.93 | 81.82 | ||
| 3. | 82.14 | 82.34 | 80.16 | 84.47 | 81.53 | ||
| - | 81.72 | 81.97 | 79.82 | 84.11 | 81.15 | ||
| 4. | — | 81.80 | 79.80 | 83.72 | 80.44 | ||
| 5. | 80.89 | 81.46 | 79.15 | 83.85 | 80.81 | ||
| 6. | 81.17 | 80.84 | 78.70 | 82.91 | 80.34 | ||
| 7. | 80.58 | 80.46 | 78.37 | 82.55 | 80.17 | ||
| 8. | 79.46 | 80.06 | 77.69 | 82.56 | 79.51 | ||
| 9. | 79.66 | 79.89 | 77.93 | 81.87 | 79.28 | ||
| 10. | 79.41 | 79.88 | 77.73 | 82.12 | 79.64 | ||
| 11. | — | 78.68 | 75.92 | 81.47 | 77.25 | ||
| 12. | — | 77.00 | 75.10 | 78.88 | 76.77 | ||
| 13. | — | 70.74 | 68.18 | 72.69 | 71.53 | ||
Past life expectancy
| Province/Territory | 2019[10] | 2010[10] | 2000[10] | 1990[10] | 1980[10] | Change 1980-2019 |
|---|---|---|---|---|---|---|
| 82.1 | 81.2 | 79.0 | 77.6 | 75.5 | ||
| 81.6 | 81.3 | 79.4 | 77.8 | 75.0 | ||
| 82.4 | 82.1 | 80.3 | 78.1 | 76.0 | ||
| 80.1 | 79.9 | 78.0 | 77.4 | 75.3 | ||
| 80.7 | 80.7 | 78.9 | 77.3 | 74.5 | ||
| 80.0 | 79.6 | 77.3 | 76.1 | 74.8 | ||
| 77.4 | 77.8 | 75.5 | 72.4 | 68.7 | ||
| 80.4 | 80.3 | 78.5 | 76.7 | 74.6 | ||
| 71.1 | 70.4 | 67.5 | 65.5 | 62.4 | ||
| 82.4 | 81.7 | 79.4 | 77.8 | 75.4 | ||
| 81.6 | 81.3 | 78.4 | 76.9 | 76.2 | ||
| 82.9 | 81.4 | 79.0 | 77.0 | 74.4 | ||
| 80.3 | 79.6 | 78.5 | 77.9 | 75.9 | ||
| 79.0 | 77.3 | 75.0 | 74.4 | 69.8 |
Global Data Lab (2019–2022)
| region | 2019 | 2019 →2021 |
2021 | 2021 →2022 |
2022 | 2019 →2022 | ||||||
|---|---|---|---|---|---|---|---|---|---|---|---|---|
| overall | male | female | F Δ M | overall | overall | male | female | F Δ M | ||||
| Canada on average | 82.36 | 80.28 | 84.42 | 4.14 | 0.30 | 82.66 | 0.19 | 82.85 | 80.87 | 84.80 | 3.93 | 0.49 |
| Quebec | 82.97 | 81.23 | 84.62 | 3.39 | 0.29 | 83.26 | 0.19 | 83.45 | 81.83 | 85.00 | 3.17 | 0.48 |
| British Columbia | 82.79 | 80.39 | 85.24 | 4.85 | 0.29 | 83.08 | 0.19 | 83.27 | 80.98 | 85.62 | 4.64 | 0.48 |
| Ontario | 82.74 | 80.62 | 84.78 | 4.16 | 0.29 | 83.03 | 0.19 | 83.22 | 81.21 | 85.16 | 3.95 | 0.48 |
| Prince Edward Island, Yukon, Northwest Territories, Nunavut | 82.19 | 80.26 | 84.03 | 3.77 | 0.30 | 82.49 | 0.19 | 82.68 | 80.85 | 84.40 | 3.55 | 0.49 |
| Alberta | 81.85 | 79.60 | 84.16 | 4.56 | 0.29 | 82.14 | 0.19 | 82.33 | 80.19 | 84.54 | 4.35 | 0.48 |
| New Brunswick | 81.23 | 79.15 | 83.22 | 4.07 | 0.29 | 81.52 | 0.19 | 81.71 | 79.73 | 83.59 | 3.86 | 0.48 |
| Nova Scotia | 80.85 | 78.82 | 82.85 | 4.03 | 0.28 | 81.13 | 0.19 | 81.32 | 79.40 | 83.22 | 3.82 | 0.47 |
| Saskatchewan | 80.38 | 78.14 | 82.86 | 4.72 | 0.29 | 80.67 | 0.19 | 80.86 | 78.71 | 83.23 | 4.52 | 0.48 |
| Newfoundland and Labrador | 80.27 | 78.38 | 82.17 | 3.79 | 0.29 | 80.56 | 0.19 | 80.75 | 78.95 | 82.54 | 3.59 | 0.48 |
| Manitoba | 80.26 | 78.18 | 82.42 | 4.24 | 0.29 | 80.55 | 0.19 | 80.74 | 78.75 | 82.79 | 4.04 | 0.48 |
Data source: Global Data Lab[11]
See also
- List of North American countries by life expectancy
- List of Canadian provinces and territories by GDP
- List of Canadian provinces and territories by Human Development Index
- List of governments in Canada by annual expenditures
- List of Canadian provincial and territorial name etymologies
- Population of Canada by province and territory
Notes
References
- ^ a b c d e f g "Life expectancy and other elements of the complete life table, three-year estimates, Canada, all provinces except Prince Edward Island". Statistics Canada. 4 December 2024. Retrieved 22 February 2025.
- ^ a b "Life expectancy and other elements of the complete life table, single-year estimates, Canada, all provinces except Prince Edward Island". Statistics Canada. 4 December 2024. Retrieved 22 February 2025.
- ^ a b c d e f "Life expectancy and other elements of the abridged life table, three-year estimates, Prince Edward Island and the territories". Statistics Canada. 4 December 2024. Retrieved 22 February 2025.
- ^ a b c d "Life expectancy, at birth and at age 65, by sex, three-year average, Canada, provinces, territories, health regions and peer groups". Statistics Canada. 30 May 2019.
- ^ a b c "Life expectancy at birth, total - Canada". World Bank Group.
- ^ "Life expectancy at birth: Canada". Our World in Data.
- ^ "Life expectancy at birth: Canada, United States". Our World in Data.
- ^ "Statistics Canada". 25 November 2013.
- ^ a b "Life expectancy and Healthy life expectancy, data by country". World Health Organization. 2020. Retrieved 22 January 2024.
- ^ a b c d e "Canadian male and Female Life Expectancy By Province".
- ^ "Life expectancy 2022 - Maps | Subnational HDI (v8.0)". Global Data Lab. Retrieved 15 October 2024.
| History |
| ||||
|---|---|---|---|---|---|
| Provinces and territories |
| ||||
| Geography |
| ||||
| Government |
| ||||
| Economy | |||||
| Demographics |
| ||||
| Society | |||||
| Culture |
| ||||
| Contents | |||||
| Research | |||||
| Search | |||||
| |||||